Smart MACD Reversal Oscillator Pro
What Sets This Indicator Apart
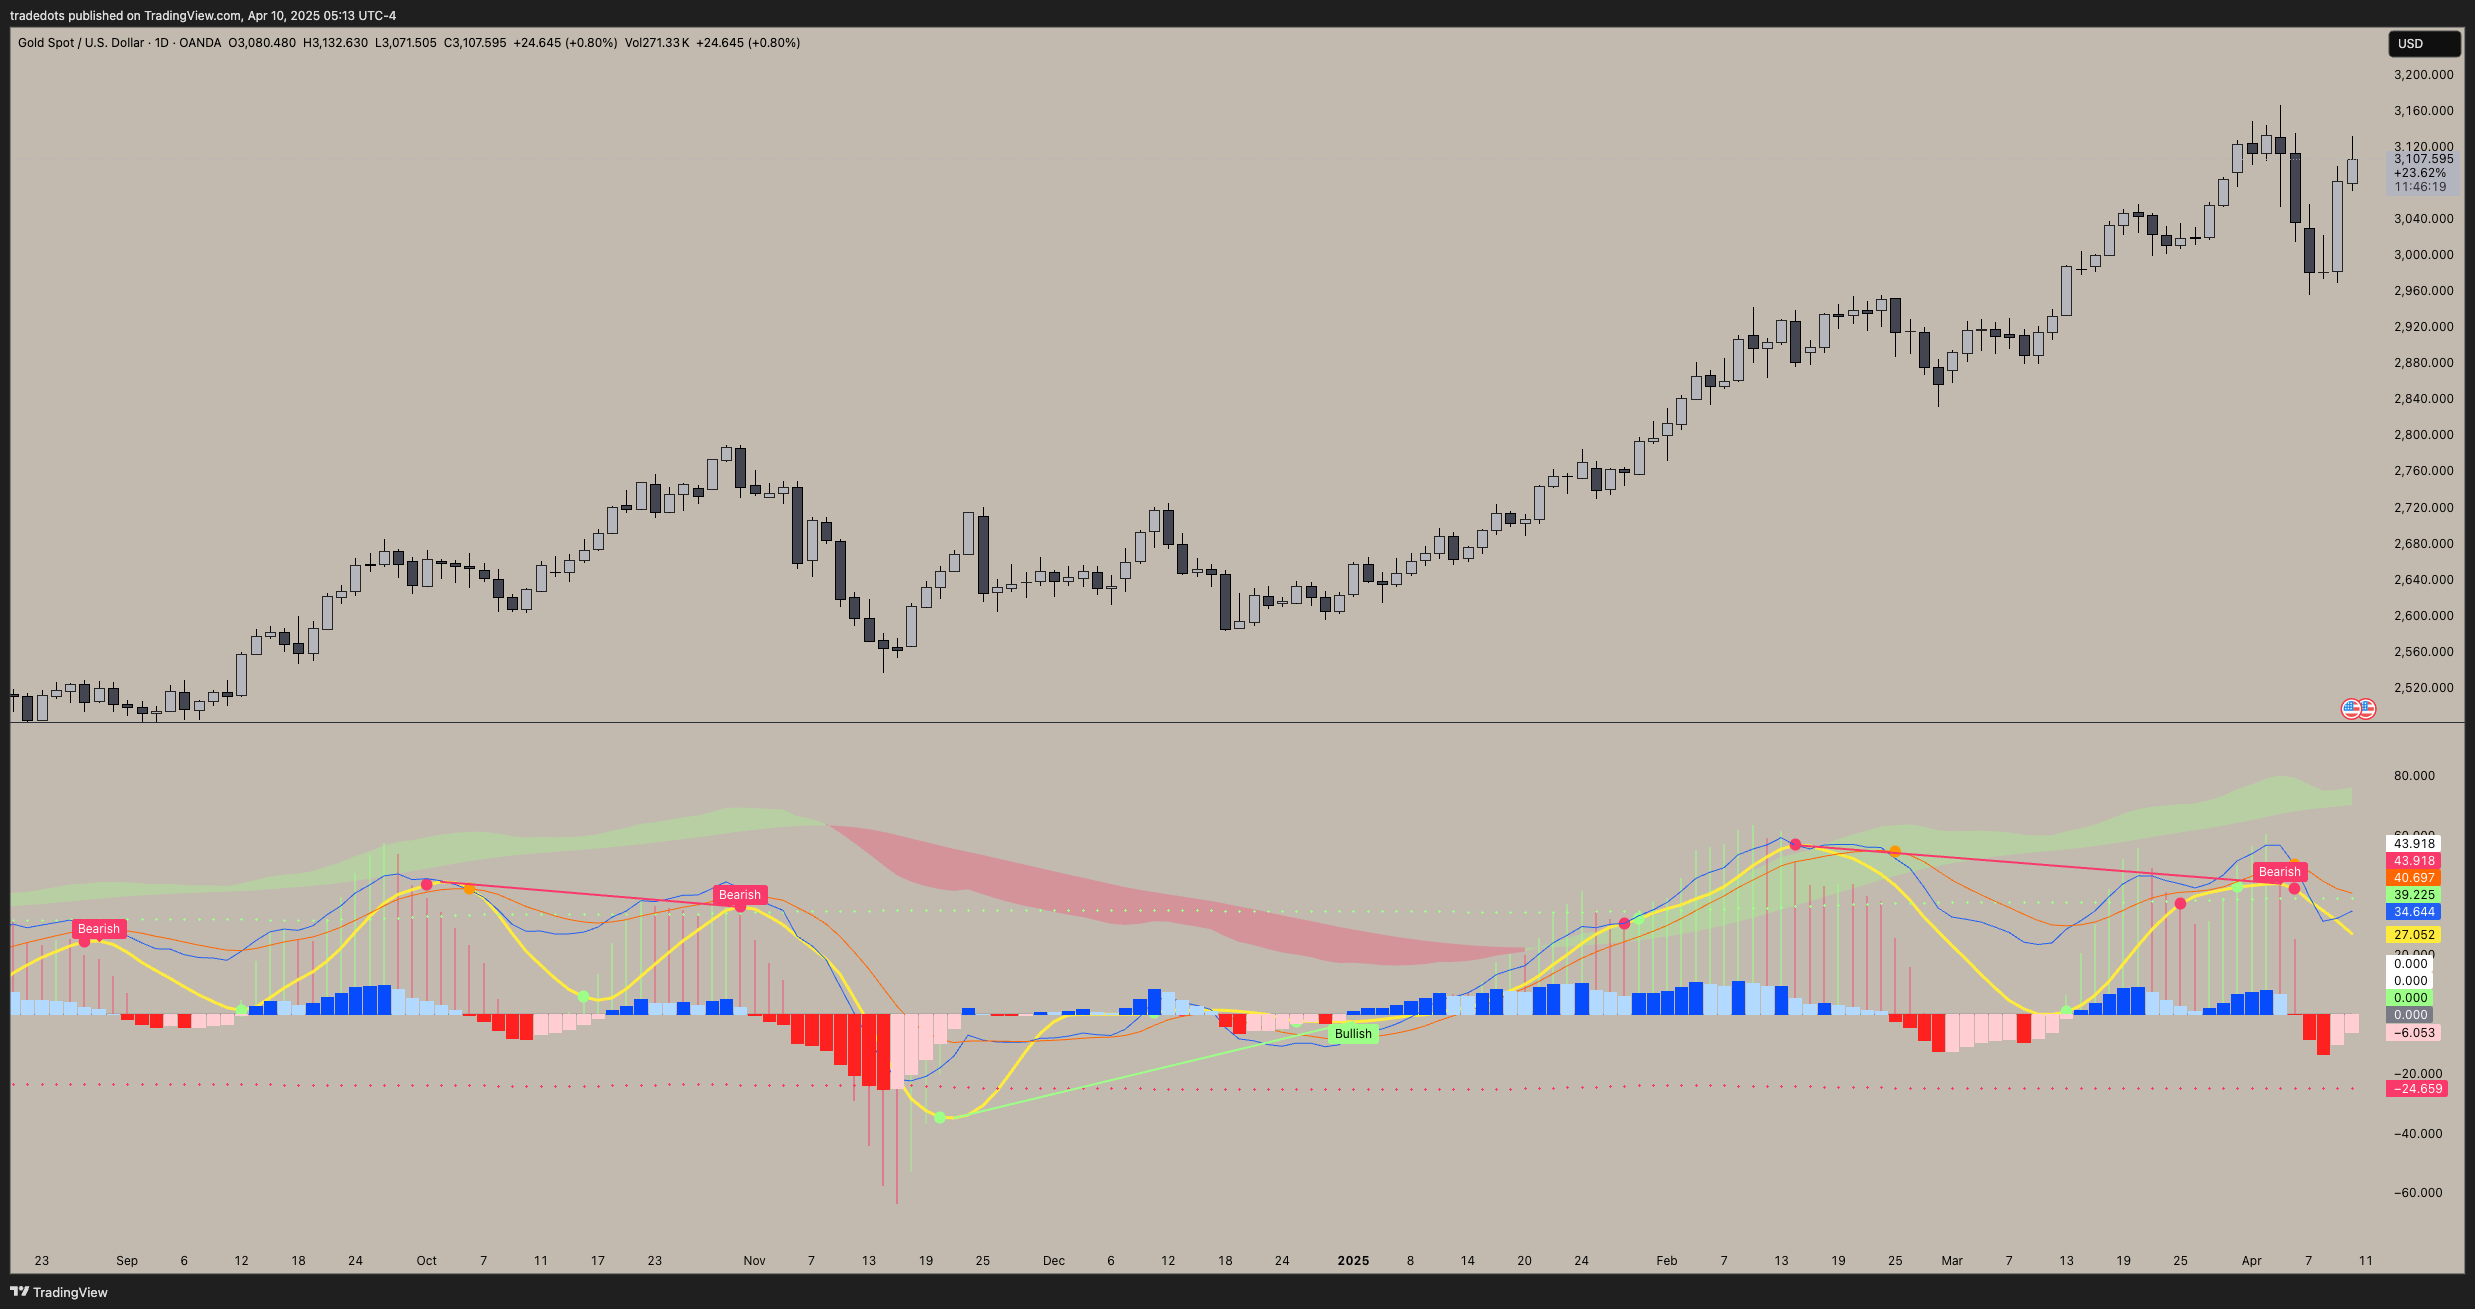
The Smart MACD Reversal Oscillator Pro transforms the traditional MACD indicator into a comprehensive momentum analysis system. While standard MACD indicators show basic crossovers, our enhanced version provides:
- Multi-level momentum analysis with color-coded strength indicators
- Automatic divergence detection to identify potential reversals early
- Precise signal dots showing optimal entry and exit points
- Overbought/oversold bands to identify extreme market conditions
- Accumulation/distribution visualization to track institutional activity
This powerful combination helps you identify high-probability trading opportunities that standard indicators often miss.
Key Components Explained
1. Traditional MACD Display
The primary display consists of several integrated elements:
- MACD Line (Blue): Shows momentum changes based on moving average relationships
- Signal Line (Orange): Displays the average of the MACD line, creating crossover opportunities
- Histogram Bars: Color-changing columns indicating momentum strength
- Blue/Light Blue: Positive momentum (brighter blue indicates stronger bullish momentum)
- Red/Pink: Negative momentum (brighter red indicates stronger bearish momentum)
2. Bottom Accumulation System
Located at the bottom of the oscillator panel:
- Green Filled Area: Shows accumulation phase (bullish)
- Red Filled Area: Shows distribution phase (bearish)
- Zero Line: Acts as a reference point for momentum direction
This component helps identify when smart money is accumulating or distributing positions.
3. Primary Oscillator Indicators
The core momentum measurement system includes:
- Main Oscillator: Colored histogram showing momentum
- Bright Green: Price above average with high values
- Light Green: Price above average
- Bright Red: Price below average with low values
- Light Red: Price below average
- Signal Line: Yellow line showing smoothed oscillator movement
- Bands System: Green/red horizontal lines showing overbought/oversold zones
4. Divergence Detection System
Automatically identifies when price and momentum move in opposite directions:
- "Bullish" Labels: Appear when price makes lower lows while the oscillator makes higher lows
- "Bearish" Labels: Appear when price makes higher highs while the oscillator makes lower highs
- Divergence Points: Clearly marked on both price and oscillator for easy identification
5. Signal Dots
Precise entry and exit markers:
- Green Dots: Bullish crossover signals (oscillator crosses above signal line)
- Red Dots: Bearish crossover signals (oscillator crosses below signal line)
- Blue Dots: Secondary MACD bullish crossover confirmation
- Orange Dots: Secondary MACD bearish crossover confirmation
How to Interpret the Signals
Reading Momentum Direction
-
Histogram Color:
- Green Shades: Bullish momentum (brighter = stronger)
- Red Shades: Bearish momentum (brighter = stronger)
-
Oscillator Position:
- Above zero: Bullish momentum
- Below zero: Bearish momentum
- Near extreme bands: Potentially overbought/oversold
Identifying Buy Signals
Look for multiple confirmations:
- Green Dots: Oscillator crosses above Signal line
- "Bullish" Label: Bullish divergence detected
- Green Fill Expanding: Accumulation phase strengthening
- Histogram Changing from Red to Green: Momentum shift from bearish to bullish
- Blue Dots: Traditional MACD bullish crossover in oversold territory
Identifying Sell Signals
Look for multiple confirmations:
- Red Dots: Oscillator crosses below Signal line
- "Bearish" Label: Bearish divergence detected
- Red Fill Expanding: Distribution phase strengthening
- Histogram Changing from Green to Red: Momentum shift from bullish to bearish
- Orange Dots: Traditional MACD bearish crossover in overbought territory
Recognizing Overbought/Oversold Conditions
- Long Average Line: When the oscillator approaches or exceeds this level, the market is potentially overbought
- Short Average Line: When the oscillator approaches or falls below this level, the market is potentially oversold
- Most Reliable Signals: Occur when indicators reverse at these extreme bands
Practical Trading Strategies
1. Momentum Crossover Strategy
Best for trending markets:
- Wait for green/red dots to appear (oscillator crossing Signal line)
- Confirm with histogram color change
- Enter in the direction of the cross (buy on green dots, sell on red dots)
- Set stops based on recent swing points
- Target next resistance/support or hold until opposing signal appears
2. Divergence Trading Strategy
Best for identifying potential reversals:
- Identify "Bullish" or "Bearish" divergence labels
- Wait for confirming dot signal in the same direction
- Enter when both divergence and dot signal align
- Use tighter stops as divergences can provide more precise reversal points
- Target previous swing points or hold until opposing signal appears
3. Extreme Readings Strategy
Best for counter-trend opportunities:
- Wait for oscillator to reach extreme bands (Long or Short Average lines)
- Look for crossover signals at these extreme levels:
- Bullish Crossover (Oversold): Green dots when oscillator is below Short Average
- Bearish Crossover (Overbought): Red dots when oscillator is above Long Average
- Enter when price confirms the reversal
- Set stops beyond the recent extreme
- Target the opposite band or at least the zero line
Customization Options
Adjust these parameters to optimize the indicator for your trading style:
- Y-axis scale factor: Controls the band range multiplier (default 2.5)
- Parameter 1: Controls the smoothing period for main calculations (default 8)
- Parameter 2: Controls the signal line calculation period (default 9)
- Fast/Slow Length: Controls traditional MACD calculation periods (12/26)
- Divergence Settings: Controls sensitivity of divergence detection
- Don't touch the zero line?: Toggle option for divergence requirement
Best Practices
- Confirm Signals with Price Action: Always look for candlestick confirmation of oscillator signals
- Multiple Timeframe Analysis: Verify signals across different timeframes
- Focus on Extreme Readings: Most reliable signals occur at overbought/oversold levels
- Divergence Priority: Give more weight to signals that include divergence patterns
- Color Changes as Warning: Pay attention to subtle changes in histogram colors as early warning
- Combined Signals: Look for traditional MACD confirmation (blue/orange dots) of the main signals
- Use the Alert System: Set up alerts for specific conditions that match your trading strategy
Setting Up Alerts
The indicator offers multiple alert conditions:
- Bullish Crossover (Oversold): Green dot when oscillator is below Short Average line
- Bearish Crossover (Overbought): Red dot when oscillator is above Long Average line
- Green Dot: Any bullish crossover
- Red Dot: Any bearish crossover
- Bullish Divergence: When price shows a bullish divergence
- Bearish Divergence: When price shows a bearish divergence
Real-World Examples
Example 1: Bullish Reversal with Divergence
In this example, notice how:
- The price made lower lows (points A and B)
- The oscillator made higher lows (bullish divergence)
- A green dot appeared, confirming the bullish signal
- Price subsequently rallied significantly
Example 2: Bearish Reversal at Overbought Level
In this example, notice how:
- The oscillator reached the overbought band
- A red dot appeared as momentum shifted downward
- The histogram changed from bright green to light green, then red
- Price subsequently declined significantly
Frequently Asked Questions
Q: How is this different from a standard MACD?
A: Unlike traditional MACD indicators that only show basic crossovers, the Smart MACD Reversal Oscillator Pro provides:
- Automatic divergence detection that identifies potential reversals before they occur
- Accumulation/distribution visualization through color-coded histograms
- Precise signal dots that mark exact entry opportunities
- Adaptive bands that adjust to market volatility
- Multi-timeframe analysis built directly into the indicator
Q: Which timeframes work best with this indicator?
A: While the indicator works on all timeframes, the 1-hour, 4-hour, and daily charts typically provide the most reliable signals with the best risk-to-reward ratios. Lower timeframes generate more signals but with higher noise, while higher timeframes produce fewer but stronger signals.
Q: How should I combine this with other TradeDots indicators?
A: The Smart MACD Reversal Oscillator Pro works exceptionally well as part of a complete trading system:
- Use with Trend Following Buy Sell Signals for trend direction confirmation
- Combine with Price & Momentum Reversal Indicator for additional reversal validation
- Add Trend & Chart Patterns indicator for market structure context
- Consider Support & Resistance Auto for optimal entry and exit points